About 15 Waterfall Chart
■ What it does
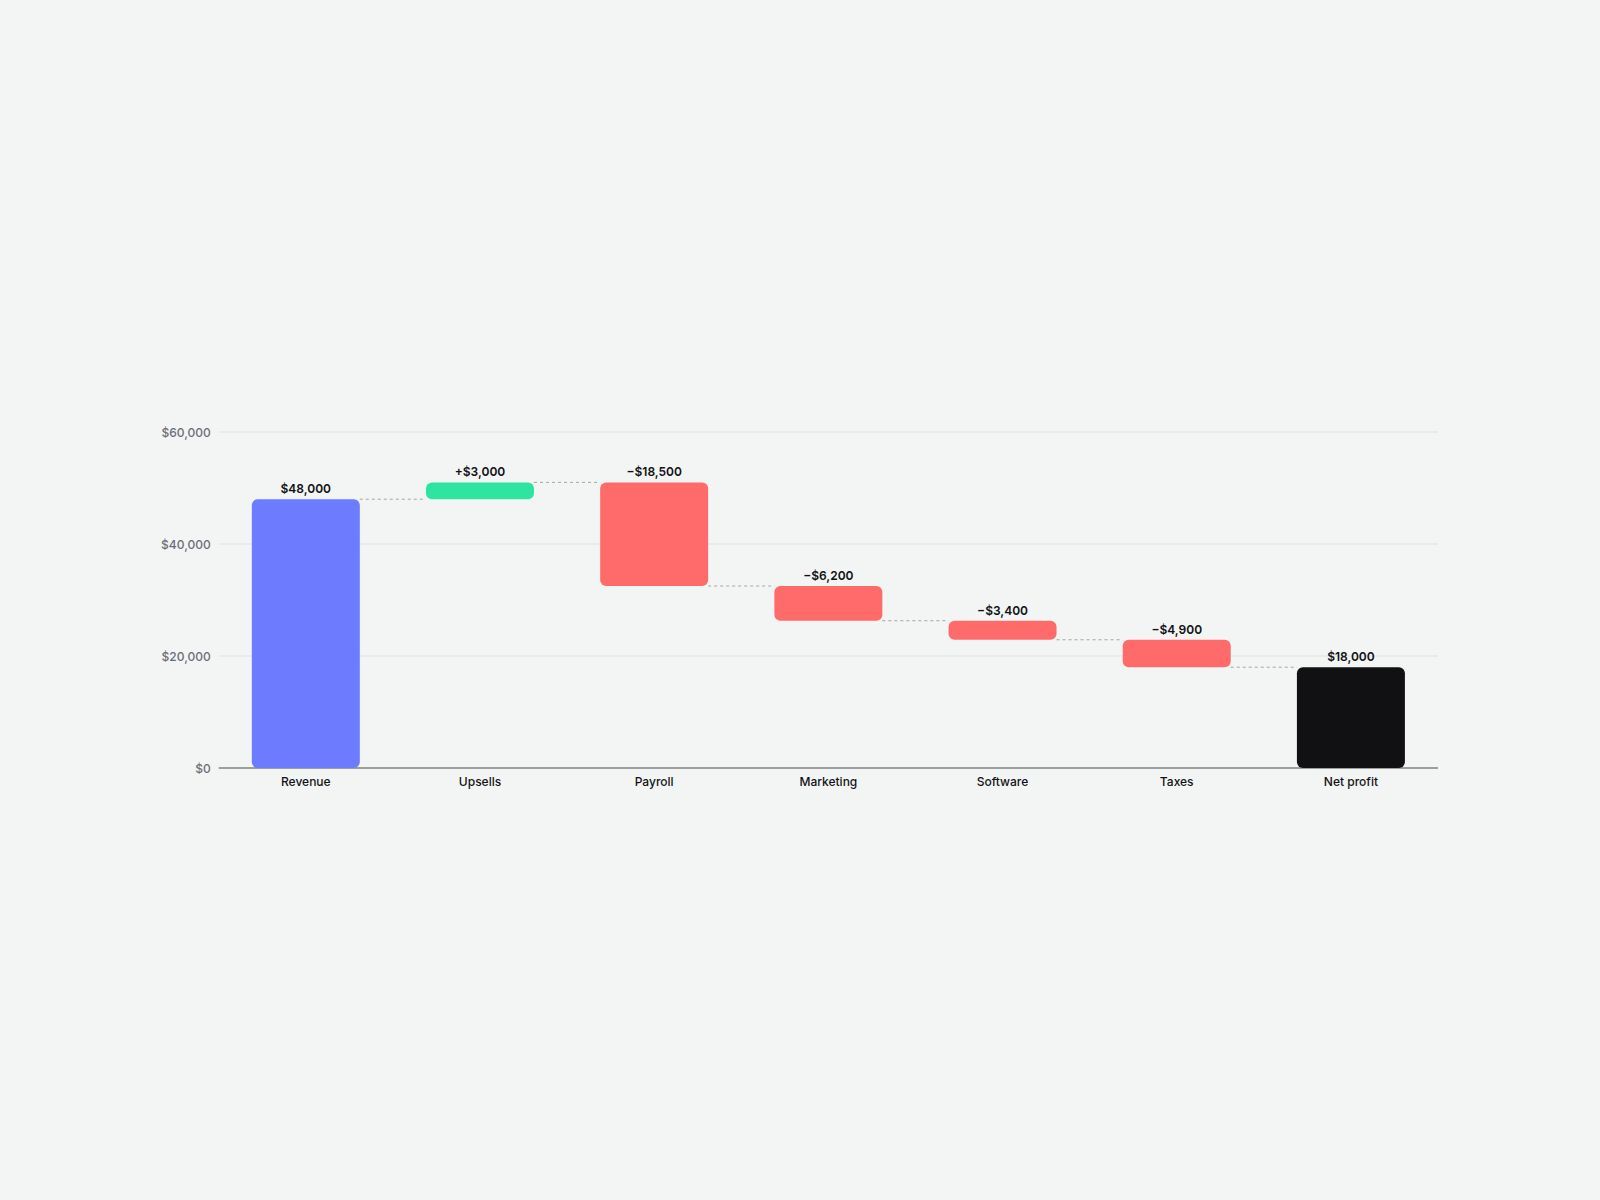
Waterfall Chart shows how a starting number turns into a final number — one step at a time. Add your items, pick Increase or Decrease for each, and the floating bars, dotted connector lines and totals are drawn for you.
Perfect for pricing breakdowns, revenue-to-profit stories, budget reports, "where does the money go" sections, and investor or fintech landing pages.
■ Customizable properties
- Items — label, type (Start, Increase, Decrease, Subtotal, Total) and value for each step
- Direction — vertical or horizontal
- Value labels — outside or inside the bars, with optional +/− signs
- Number format — currency symbol, thousands separator, decimals, suffix, and auto k/M shortening
- Colors — increase, decrease, total and start, plus text, grid, connector and background
- Axis — auto "nice number" ticks, grid lines and a zero baseline
- Tooltip — item, value and running total on hover or focus
- Animation — bars grow in one after another (stagger speed adjustable)
- Bar width, corner radius, padding and fonts
■ Need help?
Reach out anytime at hello@brandingupstudio.com — we usually reply within 1 business day.
Custom edits are available from $75/hr.
■ More resources
Explore more components at BrandingUp → https://brandingupstudio.com
Built with code but fully customizable via property controls — no coding needed.
Unlink is not provided so we can keep delivering updates. When an update is available, just click the Update button on the component.