About 34 Activity Heatmap
What it does
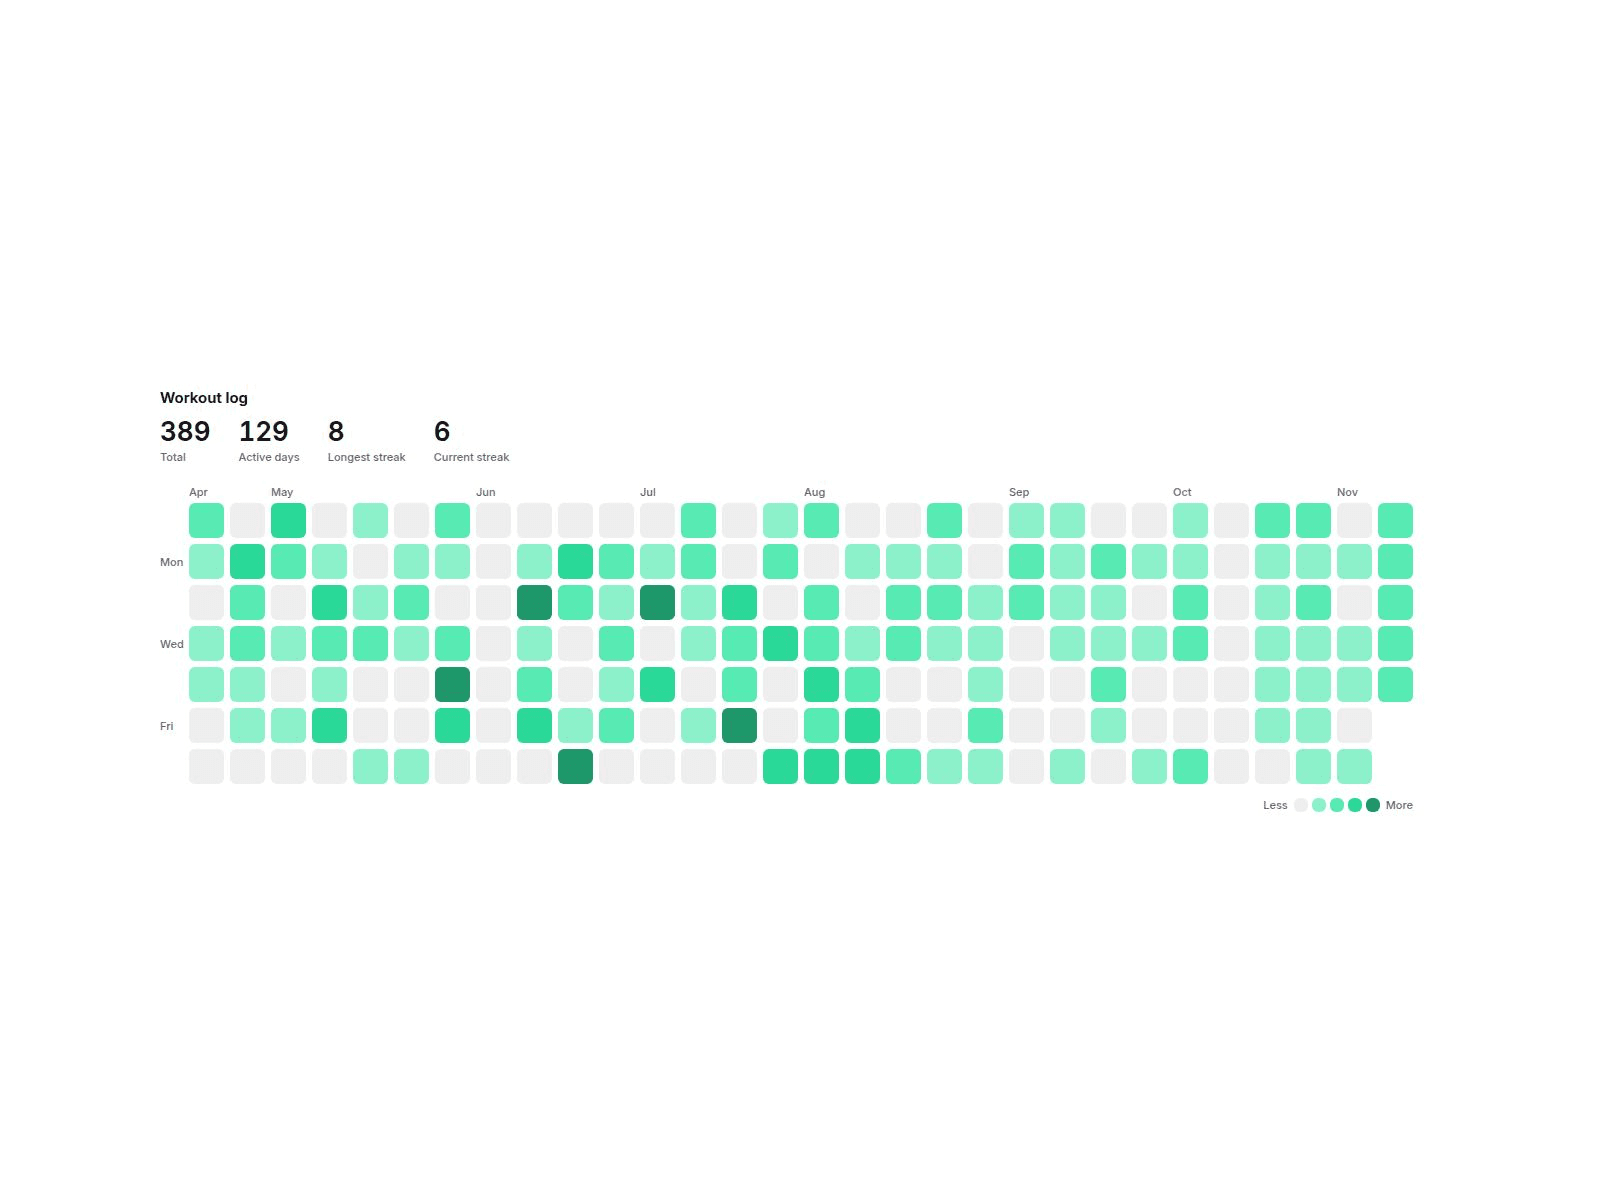
A contribution-style calendar heatmap that runs on your own data. Type or paste one day per line (2026-03-14, 5) and each day becomes a colored cell: workouts, sales, posts published, study hours, habits. No account to connect and no API. Looks finished on install with demo data.
Customizable properties
• Data: one line per day, or paste two spreadsheet columns. A date alone counts as 1 and repeated dates add up
• Range: the last 4 to 53 weeks (ending today or on your last entry) or a full calendar year
• Week starts on Sunday or Monday; month labels; weekday labels (none, Mon Wed Fri, all)
• 7 color themes or your own color; 2 to 6 shades built from it (even or quantile scale)
• Stats row: total, active days, longest streak, current streak (rename or hide each)
• Legend with editable Less / More text, hover tooltip with value and date
• Cell size (fit to width or fixed), gap, cell radius, alignment
• Locale for month names, weekdays, dates and numbers
• Light / Dark, custom colors, fonts, corner radius, padding
Why this component
• Sizes itself to the width it is given, not the window. On narrow screens it leaves out the oldest weeks instead of shrinking the cells.
• Cells fill in once when scrolled into view, then stop. Canvas and static export show the finished heatmap.
• Keyboard friendly: focus the grid and use the arrow keys to read any day.
Need help?
Reach out anytime at hello@brandingupstudio.com. We usually reply within 1 business day.
Need more? All 10 paid BrandingUp components in one payment: All-Access Pass, $49 → https://brandingup.lemonsqueezy.com/checkout/buy/3391c106-6fbc-41b8-9cc8-b63365b95665
Built with code but fully customizable via property controls, no coding needed. Unlink is not provided so we can keep delivering updates. When an update is available, just click the Update button on the component.