About Benchmark Bars
SVG Chart draws your data. Benchmark Bars makes your case — the "N× faster" section dev-tool and AI landing pages hand-code, as one component that measures nothing and sends nothing.
WHAT IT IS
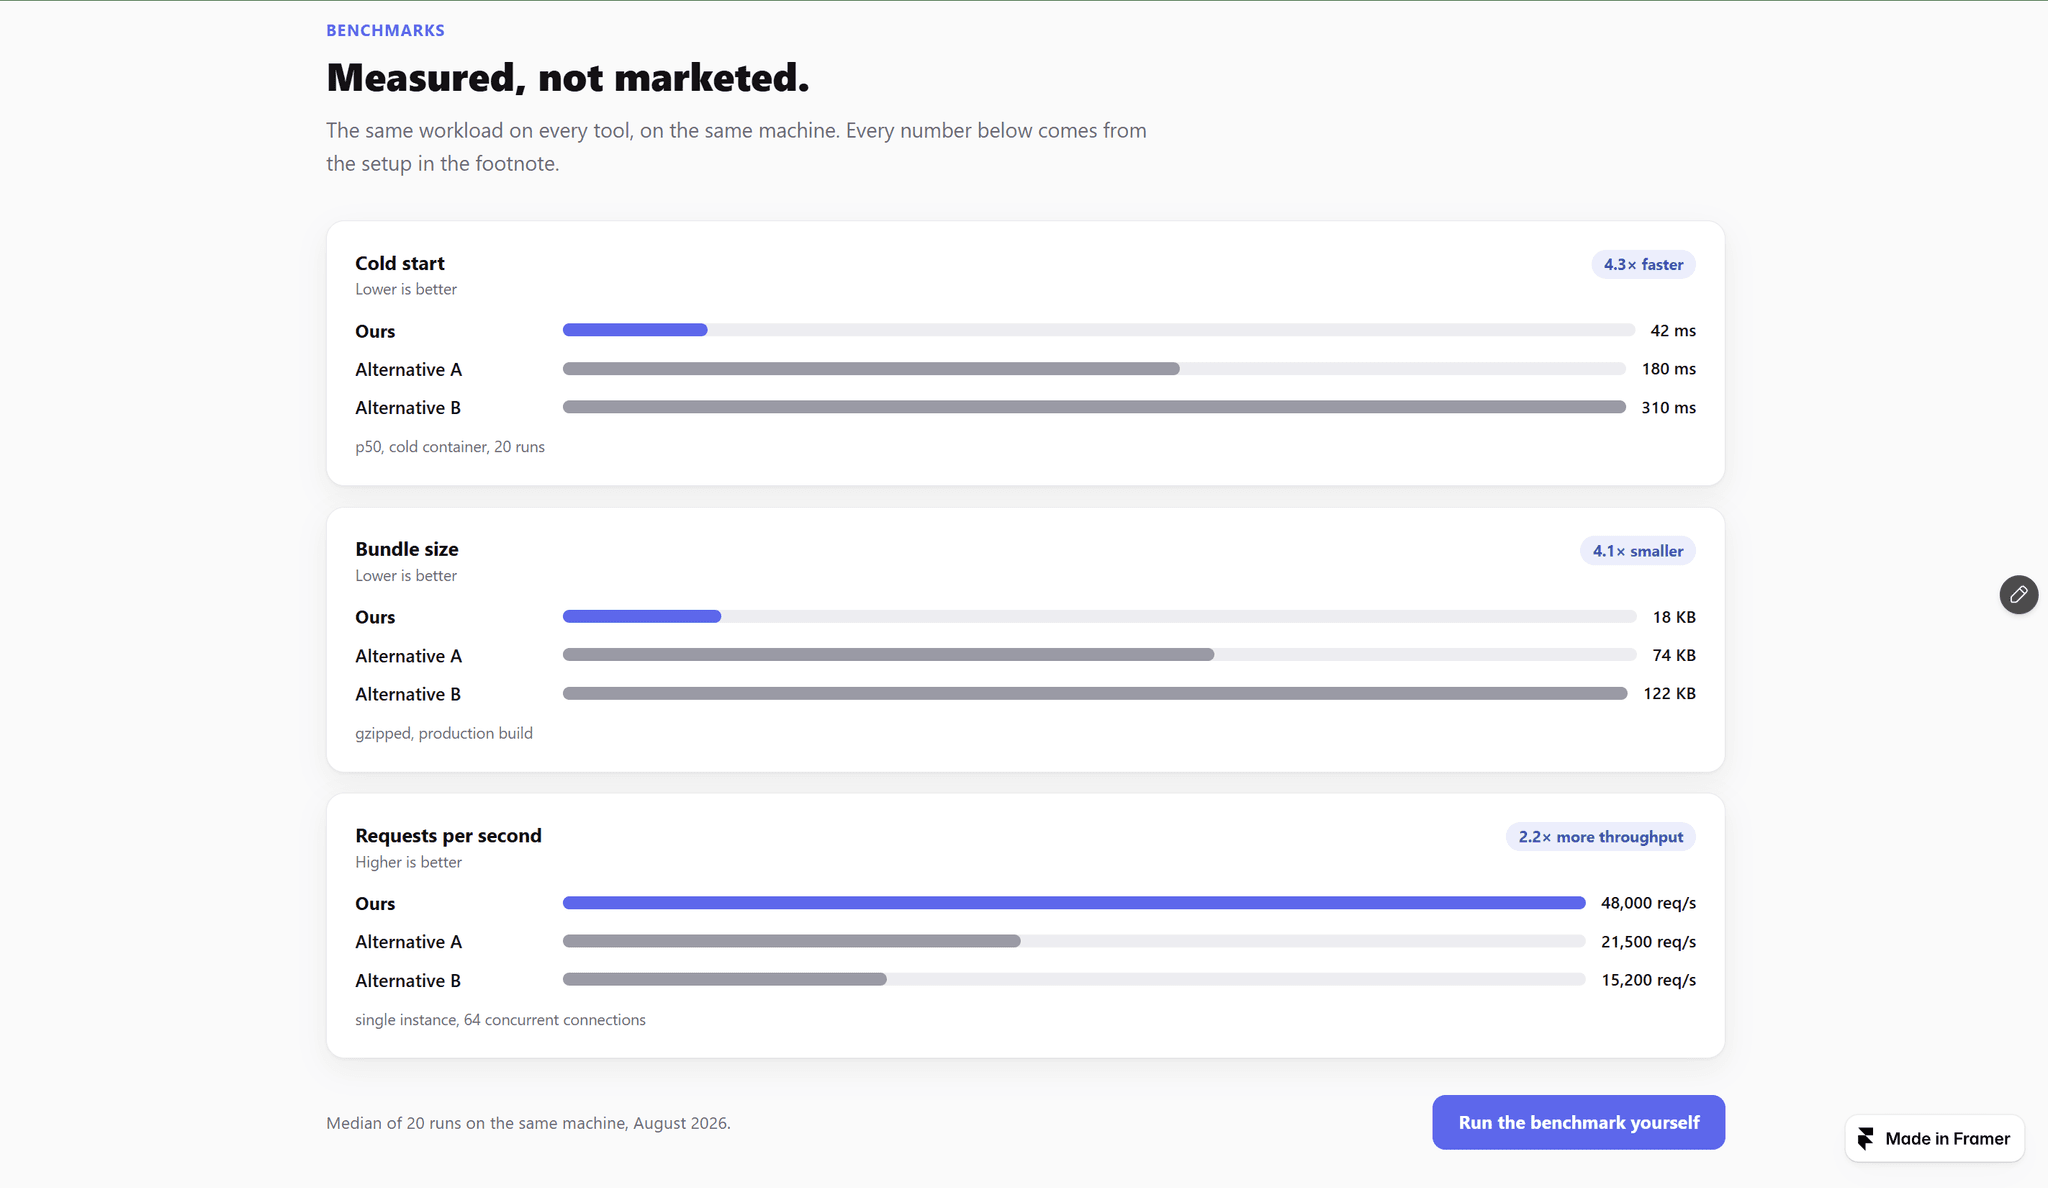
For each metric you type the rows — your product and two to five alternatives, one per line as Name | 42. The section draws horizontal bars, highlights your row, and works out the ratio against the strongest competitor: 4.3× faster, 4.1× smaller, 2.2× more throughput. Lower- and higher-is-better metrics sit side by side, each with its own hint.
WHAT YOU GET
— Horizontal bars per metric, your row in the accent color, the others in a quiet gray
— A ratio badge computed from your numbers, with your own word: faster, smaller, cheaper. It hides when your row is behind or the gap is under 1.1×
— Units before or after the value ($0.12, 42 ms, 94.2%), thousands separators kept exactly as you typed them
— A footnote per metric plus a source line and link for the section — a benchmark without its setup is just a claim
— List or two-column layout, light and dark themes, one accent color, adjustable max width
— Bars grow and numbers count up once on scroll into view; reduced-motion visitors see the final state at once
WHAT IT DOES NOT DO
It does not run benchmarks, load a chart library, or talk to a backend. The numbers are yours — measure them, type them, and say where they came from. Fictional placeholder names ship as defaults, so nothing on your page names a competitor until you do.
BUILT FOR
Developer tools, APIs, AI products, and any SaaS page with real numbers to show against the alternatives.
Zero external libraries, zero layout shift: bar widths are final from the first paint and only the fill animates, value cells reserve their width, and every row is labeled for screen readers ("Ours: 42 ms, 4.3× faster than Alternative A").
Everything is configured from the properties panel. No CMS, no code.