About Polar Area Chart
Polar Area Chart is a flexible and interactive data visualization component built for Framer that transforms complex datasets into clear, circular visual insights using variable-radius segments.
Each segment represents a value through its radius while maintaining equal angular spacing, making it ideal for comparing multiple categories in a visually balanced and intuitive format.
Key features include
Variable-radius segments representing data values with proportional scaling
Equal angular spacing for consistent circular structure
Customizable color system with six default visually balanced palettes
Configurable title and legend with full typography and alignment control
Optional grid system with concentric circles and value labels
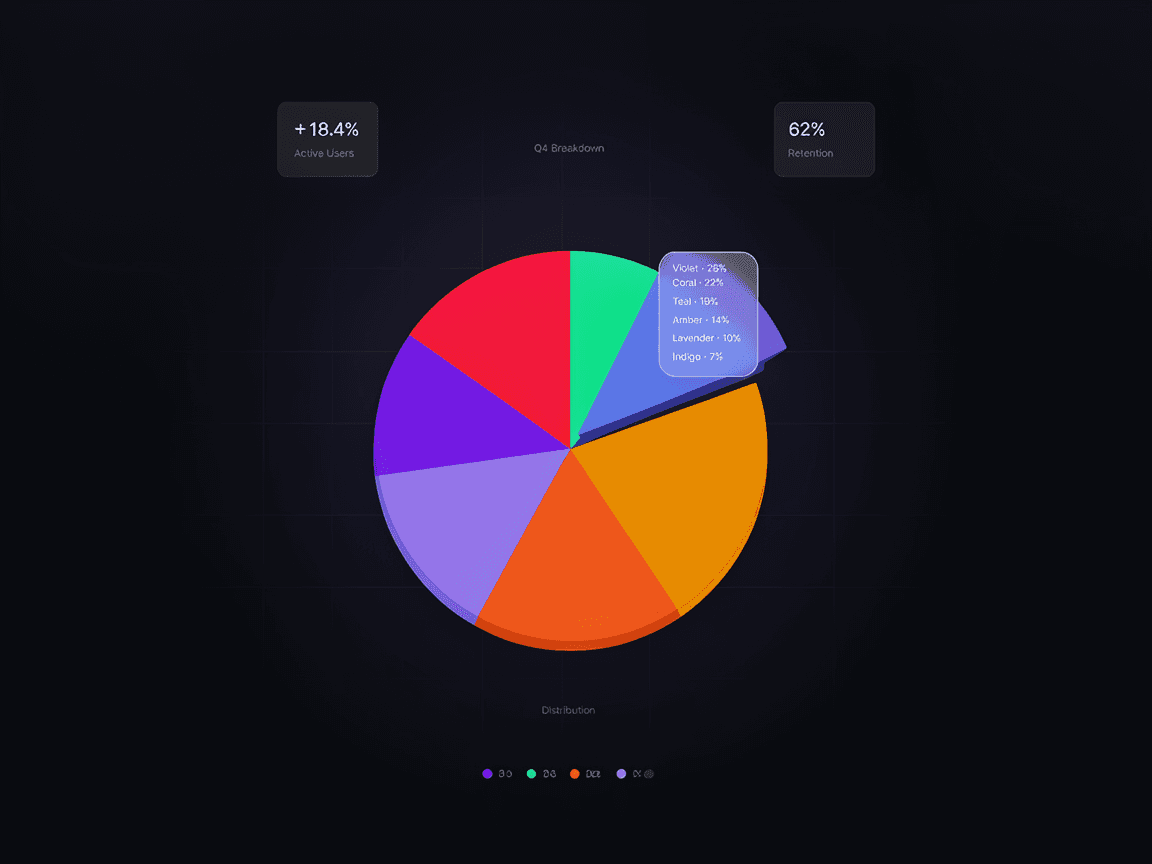
Interactive hover tooltips with detailed data feedback
Clickable segments and legend items for selection-based interaction
Smooth entry animations with adjustable timing and easing
Fully responsive design adapting to any container size
Advanced styling controls including background, shadows, border radius, and opacity
How to use
Add each segment with label, value, and color through the property panel
Customize title, legend, grid, and overall layout styling
Adjust background, spacing, border radius, shadows, and fill opacity
Enable hover tooltips and interactive selection features as needed
Best for
Financial dashboards and analytics platforms
Survey and research result visualization
Business performance and KPI tracking
Comparative multi-category data analysis
Polar Area Chart delivers a modern, interactive way to visualize complex datasets while maintaining clarity, responsiveness, and a polished professional appearance across all Framer projects.